- Connex Inventory Planner
- Spreadsheet Reports
-
Connex for QuickBooks User Guide
- Getting Started with Connex for QuickBooks
- Remote Desktop (RDP)
- Customers Matching
- Inventory Site
- Inventory Sync
- Multicurrency
- Orders
- Price Levels
- Products
- Refunds
- Sales Tax
- Sales Orders
- Unit of Measure
- Web Connector
- Getting Started with Rules
- Rules Engine Common Rules
- FAQ
- Deposit Match
- Cost of Goods Sold
- Troubleshooting
-
Connex Inventory Planner
-
Frequently Asked Questions
-
General Troubleshooting Guide
- Deposit Match Troubleshooting
- QuickBooks Desktop Error Messages
- Inventory Troubleshooting
- Incorrect Orders Troubleshooting
- Sales Tax Troubleshooting
- Web Connector Troubleshooting
- QuickBooks Online Error Messages
- Match Deposit Tool Troubleshooting
- Product Matching Troubleshooting
- Customer Matching Troubleshooting
- Rules Engine
- Orders from QuickBooks
- Payments Troubleshooting
- Missing Orders Troubleshooting
- Company File
-
Connex for QuickBooks Integrations Guide
-
Rules Engine Guide
What kind of reports can Connex generate
How to generate more reports with Connex
Are all reports in Connex available with charts and graphs?
Connex can create some reports as spreadsheets. There is no UI to view charts and graphs at this time.
How do I access these reports?
Here are the steps:
- Login to Connex.
- Click reports.
- On the top right, click generate reports.
- Choose a report and enter a date range.
What do these reports look like?
Here are the reports:
Inventory Prediction
Also known as ABC XYZ analysis. The report tells you what products represent the top 50%, middle 25% and bottom 25% of sales. For more info, read this guide.
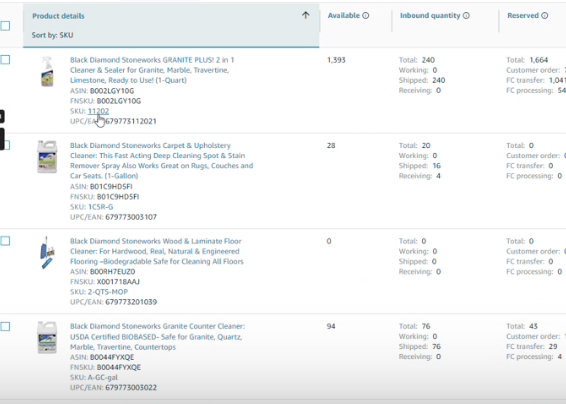
Inventory Aging
Available for Amazon users only. Also know as the Amazon inventory planner: